
SUPPORT AND RESISTANCE

In the previous chapters of our LTP Calculator free course, we learned the basics of option chain and AI LTP Calculator. Now from this chapter onwards, we will learn how to use AI LTP Calculator based on the theories of our mentor, Dr. Vinay Prakash Tiwari. In this chapter, we will learn the theory of support and resistance on AI LTP Calculator. Let’s start learning.
Lesson Highlights
What is Demand and Supply ?
The stock market operates on the basic principle of economics: demand and supply. When the demand for a particular stock increases but the supply is limited, then there is a rise in share prices. If demand decreases but supply increases, then there is a decline in share prices. Let’s try to understand this concept with an illustration.
When supply is less than demand prices go up because there aren’t enough shares for everyone who wants to buy, so buyers compete and are willing to pay more.

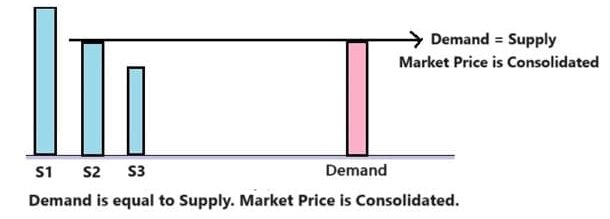
When supply is equal to demand prices stay consolidated. The number of shares available matches what buyers want, so there’s no rush to buy or sell.
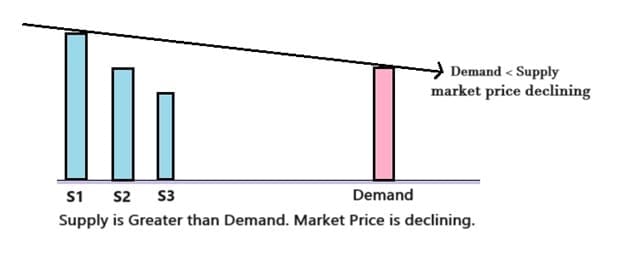
- When supply is greater than demand prices go down. There are more shares available than buyers, so sellers compete and lower their prices to attract buyers.
What is Support and Resistance ?
Support and Resistance is the market levels where the balance between demand and supply shifts, and this shift in demand and supply causes the price to reverse.
Support refers to the price level at which a falling stock or index tends to stop falling and may even reverse from there. It acts as a floor for the price, where buying interest is strong enough to prevent further decline. Traders often view support levels as potential buying opportunities.
Resistance refers to the price level at which a rising stock or index tends to stop rising and may even reverse from there. Resistance acts as a ceiling for the price, where selling pressure becomes strong enough to prevent further price increases. Traders often view resistance levels as potential selling opportunities.
There are various methods for finding support and resistance, and most traders use the price action method. This method is easy to apply with the help of various indicators and trendlines. However, these support and resistance levels are based on historical data and may not always be accurate. Therefore, we will find the support and resistance with help of option chain data.
Support and Resistance on LTP Calculator
On the option chain, most options traders believe that only open interest plays a crucial role in forming support and resistance. According to them, volume has no role on the option chain. However, the theory and definition of support and resistance that we are going to learn, as given by Dr. Vinay Prakash Tiwari, will give importance to both volume and open interest.
Definition of Support and Resistance on LTP Calculator option chain –
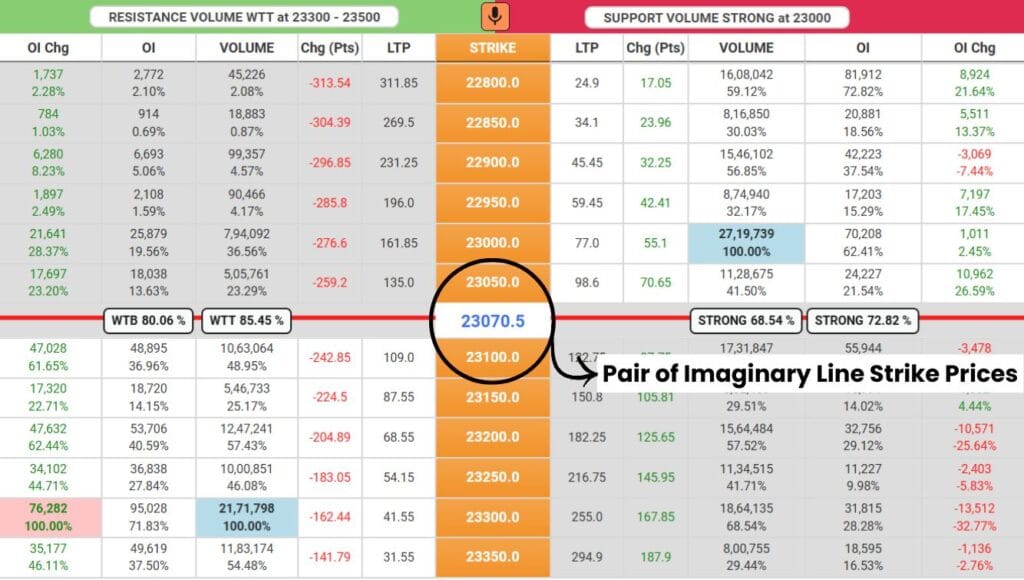
Starting from the pair of imaginary line strike prices and moving towards the OTM strike prices, highest volume or highest open interest, whichever is closest to the imaginary line, is called the support on the put side and resistance on the call side.
- Resistance is always found in Call side and Support is always found in Put side.
- According to the definition, starting from the pair of imaginary line strike prices and moving towards the OTM strike prices on the Put side, the highest volume or highest open interest, whichever is closest to the imaginary line, is called Support.
- According to the definition, starting from the pair of imaginary line strike prices and moving towards the OTM strike prices on the Call side, the highest volume or highest open interest, whichever is closest to the imaginary line, is called Resistance.
Example for Support
In the above image, let’s find the support with the help of the definition:
Starting from the pair of imaginary line strike prices – This means we first need to focus on the 23050 and 23100 strike prices. Both strike prices must be considered when initiating the search.
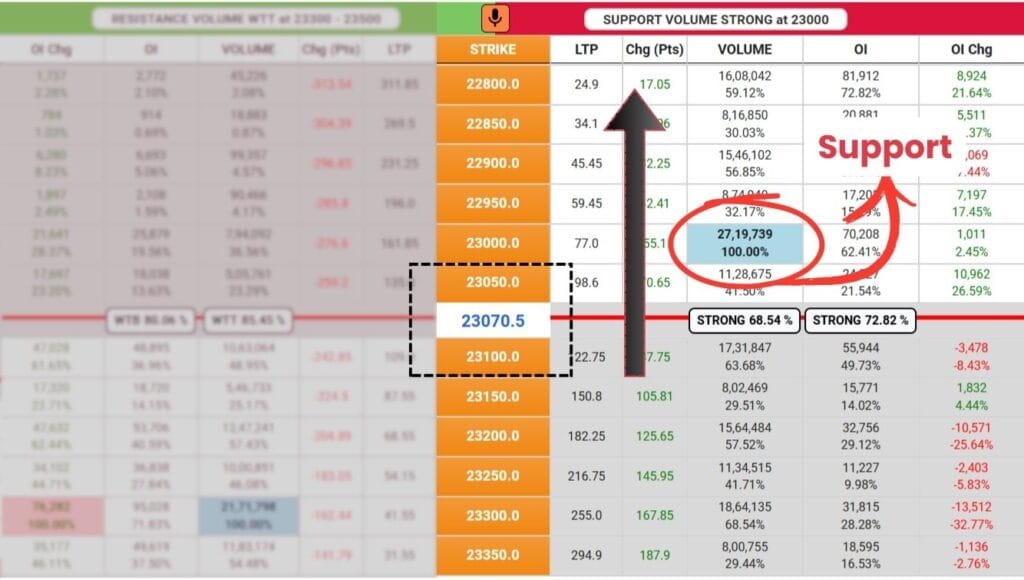
Moving towards OTM strike prices – This means we have to search from the 23100 strike price towards OTM strike prices in put side like 23050, 23000, 23950, and so on.
Highest volume or highest open interest – This means we need to identify the strike price with the highest volume and highest open interest. You can take the help of color codes (Blue and Green) to find easily. Blue Color helps you to find Highest Volume and Green Color helps you to find Highest Open Interest.
Whichever is closest to the imaginary line – This means that during the search, whichever one (volume or OI) you find first is your support. If you got both volume and OI at the same strike price, then your support is of both Volume and Open Interest.
Example for Resistance
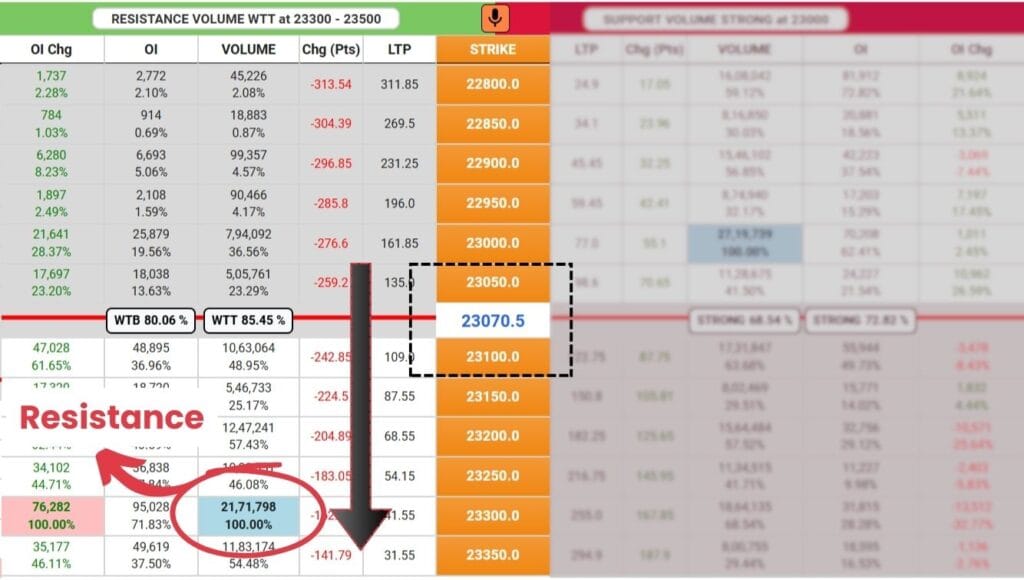
In the above image, let’s find the resistance with the help of the definition:
Starting from the pair of imaginary line strike prices – This means we first need to focus on the 23050 and 23100 strike prices. Both strike prices must be considered when initiating the search.
Moving towards OTM strike prices – This means we have to search from the 23050 strike price towards OTM strike prices in call side like 23100, 23150, 23200, and so on.
Highest volume or highest open interest – This means we need to identify the strike price with the highest volume and highest open interest. You can take the help of color codes (Blue and Pink) to find easily. Blue Color helps you to find Highest Volume and Pink Color helps you to find Highest Open Interest.
Whichever is closest to the imaginary line – This means that during the search, whichever one (volume or OI) you find first is your resistance. If you got both volume and OI at the same strike price, then your resistance is of both Volume and Open Interest.
Conclusion
In this chapter of LTP Calculator free course, we have learnt the concept of support and resistance on LTP Calculator option chain. My motive with this chapter was to teach you how to find support and resistance on AI LTP Calculator. This theory is unique, and no one else, except our mentor Dr. Vinay Prakash Tiwari, discusses the role of volume on the option chain.
So, keep learning the stock market with LTP Calculator, and believe me, one day you’ll also say, It’s a Baccho ka Khel.