
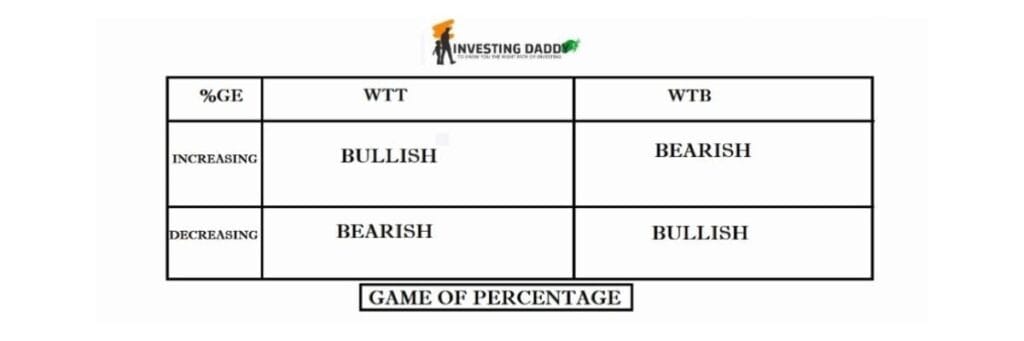
GAME OF PERCENTAGE IN WTB

In the last chapter, we learned about the Chart of Accuracy 1.0 and its nine scenarios. In COA 1.0, we observed multiple scenarios in which support and resistance were WTT and WTB. Therefore, to better understand the Chart of Accuracy 1.0, we must understand WTT and WTB and their game of percentage on the LTP Calculator. In this chapter of the LTP Calculator free course, we are going to learn the concept of the game of percentage in WTB support and resistance on AI LTP Calculator. Let’s start learning.
Lesson Highlights
Yellow Box on LTP Calculator
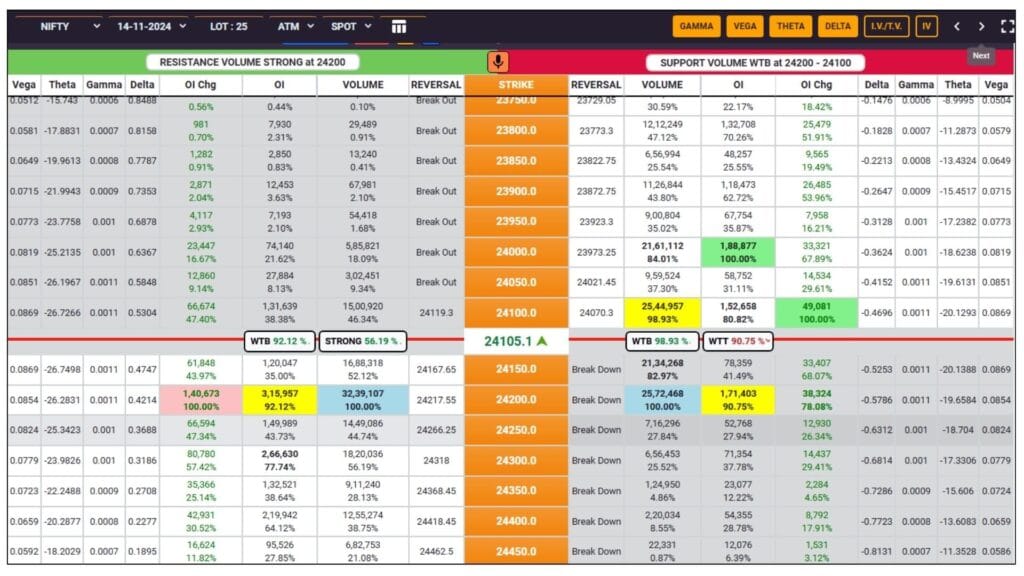
In the option chain above, you can see different colored boxes. In previous chapters, we have already learned about these color boxes on the LTP Calculator. In this chapter, our focus will be on the yellow box.
Weak towards Bottom - Support
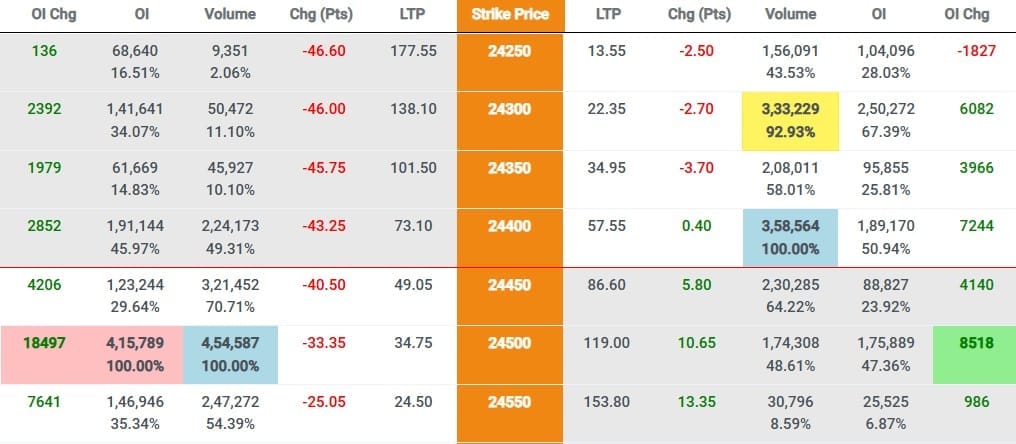
In the image below, you can clearly see that the support is at 24400, and it is WTB at 24300. The WTB percentage is 92.93%. What does this indicate? We will understand all the possible scenarios in Weak towards Bottom in support side with this case.
SCENARIO 1
In the above image, Support is at 24400, and it is WTB at 24300. The WTB percentage is 92.93%. It indicates that the second-highest value is only 7.07% lower than the highest value, meaning that the support will soon shift to 24300, only if this WTB %age keeps on increasing. It means that the market, which was expected to reverse from 24400 due to the support at that level, will no longer reverse from here. Instead, it will fall to 24300. So, we can conclude that increasing %age of WTB leads to a Bearish Market.
Please Note: Support from 24400 will shift to 24300 only when the WTB percentage, which is currently 92.93%, continues to increase, for example, to 93%…99%, and then turns blue, indicating it is the highest. Once 24300 becomes the highest, 24400 will automatically become the second highest, and the yellow box will appear at 24400. However, this does not mean that the support has now become WTT because the support has already shifted from 24400 to 24300 and due to the logic of second highest, there is yellow box at 24400. In this case, we need to ignore this WTT at 24400. If the WTT is at another strike price, we will consider it, but if the WTT is at 24400, we will ignore it. The only case, in which we will consider 24400 yellow box as WTT – If the Yellow Box at 24400 will be vanished (due to decreasing %age) and then again yellow box will appear at 24400 (due to increasing %age) only then we will consider this as WTT.
SCENARIO 2
In the above image, you can clearly see that the support is at 24400 and it is WTB at 24300. The WTB percentage is 92.93%. Now, let’s assume the WTB percentage starts decreasing from 92.93% to 90%, then 85%, and finally 80%. What does this decrease in percentage from 92 to 80 indicate? It indicates that the highest value is becoming strong in comparison to the 2nd highest value, which means that the support at 24400 is becoming strong. As a result, the market will reverse from the extension of 24400 instead of falling more till 24300. So, we can say that a decreasing percentage of WTB leads to a Bullish Market.
SCENARIO 3
In Scenario No. 2, the WTB percentage decreased from 92.93% to 80%. Now, let’s assume the WTB percentage further declines to 75%, and then the yellow box disappears. What does this indicate? When the yellow box disappears, it means that the support is now strong. The market will reverse from EOS. But it will also impact resistance, i.e., the market may break the resistance and reverse from EOR+1. When WTB disappears, it creates bullish pressure.
Weak towards Bottom - Resistance
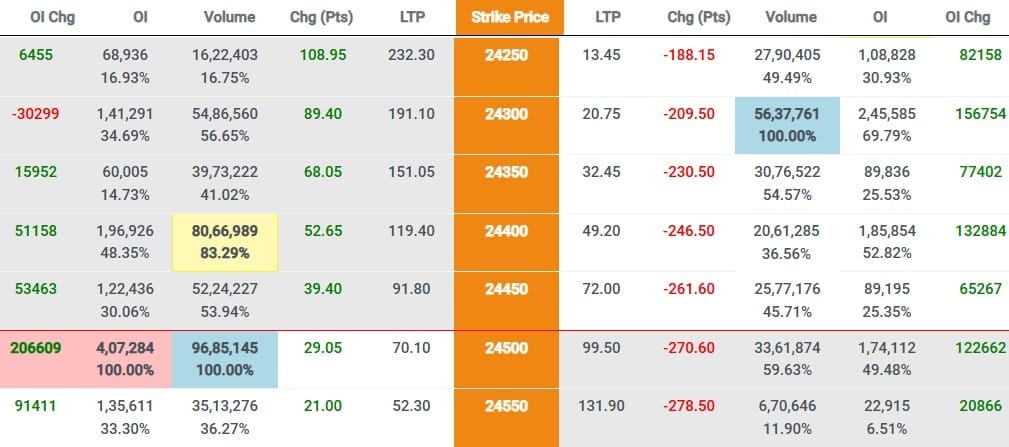
In the above image, you can clearly see that the resistance is at 24500, and it is WTB at 24400. The WTB percentage is 83.29%. What does this indicate? We will understand all the possible scenarios in Weak towards Bottom in resistance side in this case.
SCENARIO 1
In the above image, you can clearly see that the resistance is at 24500, and it is WTB at 24400. The WTB percentage is 83.29%. It indicates that the second-highest value is only 16.71% lower than the highest, meaning that the resistance will soon move to 24400 — only if this WTB percentage keeps increasing. This suggests that the market, which was about to reverse from 24500, will now reverse from 24400 due to the shifting of resistance from 24500 to 24400. Here, we can conclude that an increasing percentage of WTB leads to a Bearish Market.
Please Note: Resistance from 24500 will shift to 24400 only when the WTB percentage, which is currently 83.29%, continues to increase, for example, to 85%, 90%, 95%, 99%, and then turns blue, indicating it is the highest. Once 24400 becomes the highest, 24500 will automatically become the second highest, and the yellow box will appear at 24500. However, this does not mean that the resistance is WTT, because the resistance has already shifted from 24500 to 24400 and due to the logic of second highest, there is yellow box at 24500. In this case, we need to ignore this WTT at 24500. If the WTT is at another strike price, we will consider it, but if the WTT is at 24500, we will ignore it. The only case, in which we will consider 24500 yellow box as WTT – If the Yellow Box at 24500 will be vanished (due to decreasing %age) and then again yellow box will appear at 24500 (due to increasing %age) only then we will consider this as WTT.
SCENARIO 2
In the above image, you can clearly see that the resistance is at 24500, and it is WTB at 24400. The WTB percentage is 83.29%. Now, let’s assume the WTB percentage starts decreasing from 83% to 80%, and finally to 78%. What does this decrease in percentage from 83 to 78 indicate? It indicates that the highest value is becoming strong, which means that the resistance at 24500 is becoming strong. As a result, the market, which was trying to reverse from 24400, will now reverse from 24500. So, we can conclude that the decreasing WTB percentage leads to a Bullish Market.
SCENARIO 3
In Scenario No. 2, the WTB percentage decreased from 83% to 78%. Now, let’s assume the WTB percentage further declines to 75%, and then the yellow box disappears. What does this indicate? This process makes the resistance strong and creates a bullish pressure on the resistance, increasing the probability that the resistance will break out. As a result, the market is expected to reverse from one diversion extra, i.e., EOR+1. When WTB disappears, it creates bullish pressure.
Conclusion
In this chapter of LTP Calculator free course, we learned about the game of percentage in WTB support and resistance on LTP Calculator. My motive with this chapter was to teach you the role of game of percentage in weak towards bottom support and resistance. This understanding will help you a lot in learning the detailed chart of accuracy 1.0.
So, keep learning the stock market with LTP Calculator, and believe me, one day you’ll also say, It’s a Baccho ka Khel.