Frequently Asked Questions
Find answers to common questions about our tools
The Chart of Accuracy Practice Tool is an interactive tool created for learners of our free stock market course. It allows users to practice all 625 market scenarios from the Detailed Chart of Accuracy 1.0 by selecting specific market conditions for Support and Resistance.
Follow these simple steps:
Step 01: Select the COA version (from COA 1.1 to COA 1.9).
Step 02: The tool will update the available scenarios based on your selection.
Step 03: Choose a condition for Resistance and a condition for Support.
Step 04: The tool will instantly display the results as top and bottom of the market.
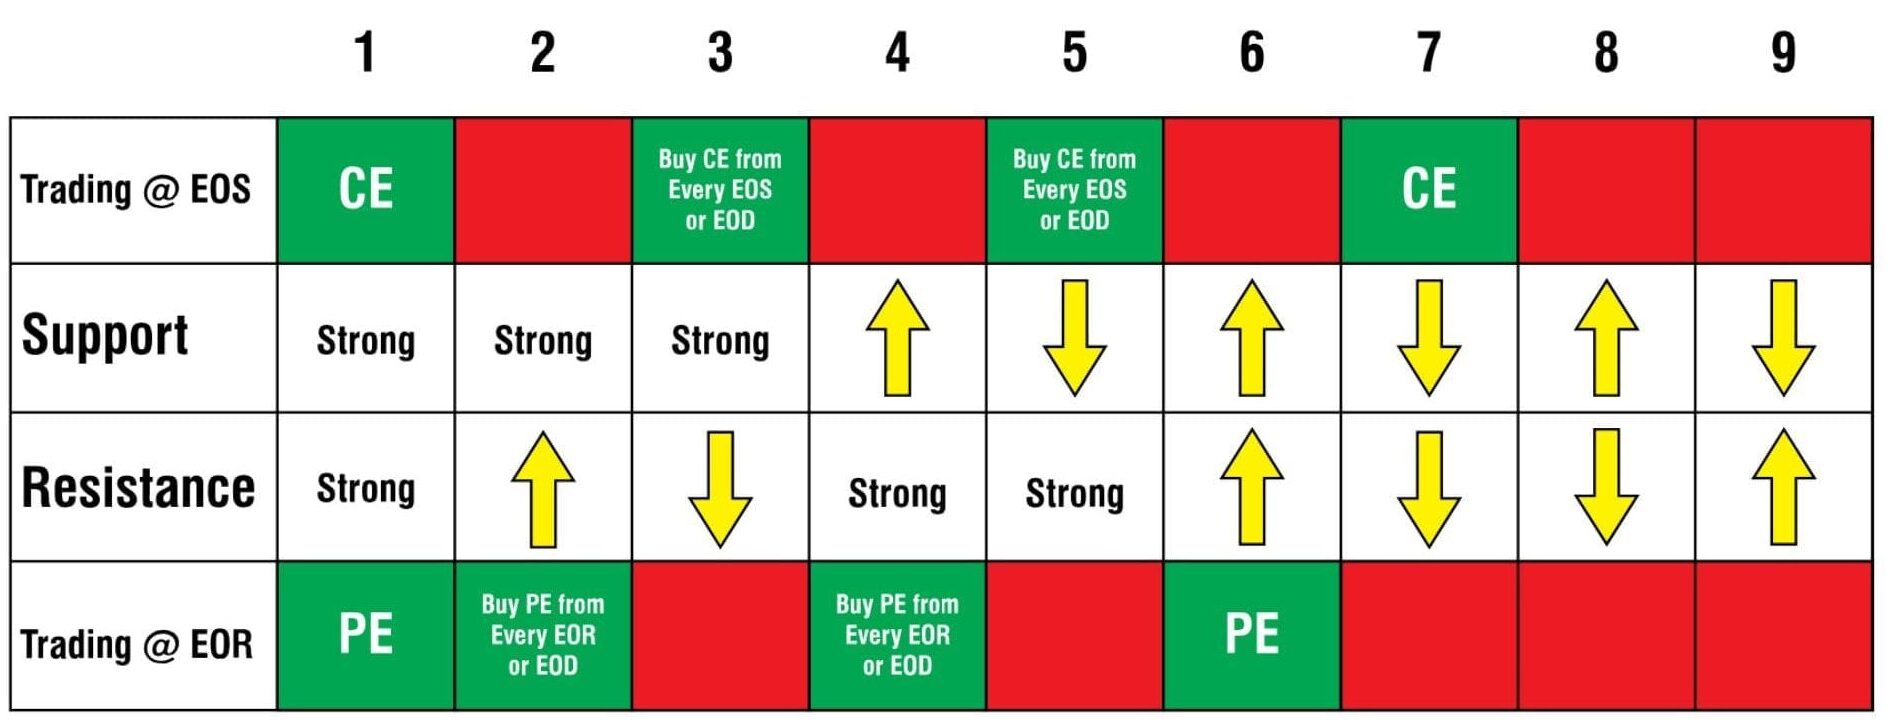
Step 05: Red color box displays the top of the market while green color displays the bottom of the market.
Match support and resistance current situation from the below image and above that there is the numbering of the condition. You have to choose that COA box.