
CHART OF ACCURACY 1.0

In the last chapter, we learned about the theory of the Six Kinds of Reversal, which includes terms such as Extensions and Diversions. In this chapter , we will learn the theory of the Chart of Accuracy 1.0. This theory of the Chart of Accuracy includes nine different scenarios around which the entire Indian stock market revolves.
Lesson Highlights
Important terms in COA 1.0
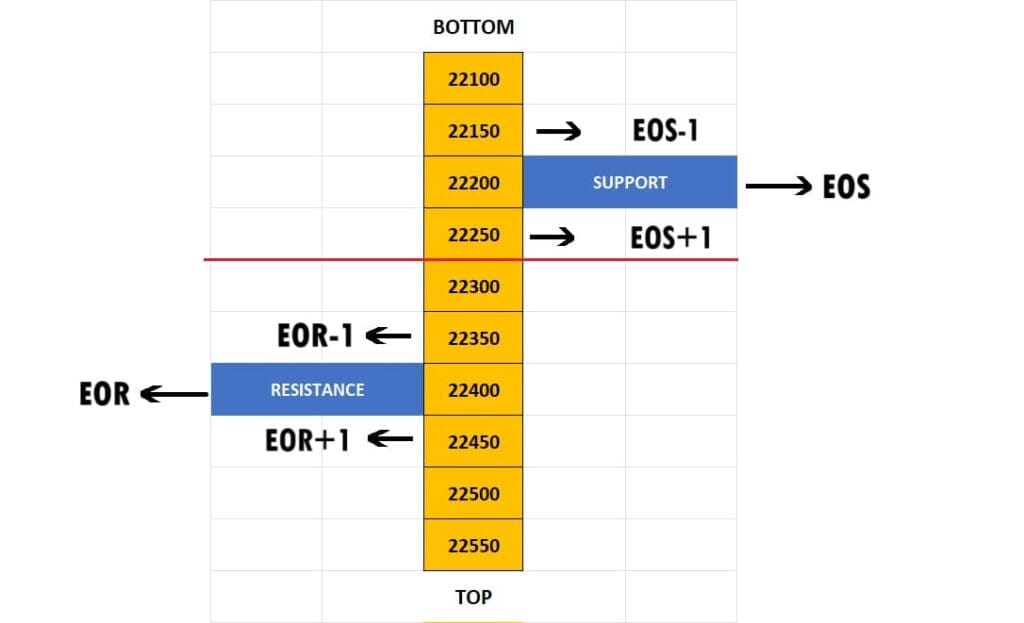
In the above image, support is at 22,200 and resistance is at 22,400. The reversal price that we get by clicking on the volume of support is called the Extension of Support (EOS), and the reversal price that we get by clicking on the volume of resistance is called the Extension of Resistance (EOR).
Always remember, when we talk about EOR+1 or EOS+1, it means we are referring to higher strike prices, i.e., towards the top of the option chain. +1 means one strike price above the EOS/EOR (higher strike price). The same applies to EOS-1 or EOR-1. When we refer to -1, it means we are talking about smaller strike prices, i.e., towards the bottom of the option chain. -1 means one strike price below the EOS/EOR (lower strike price).
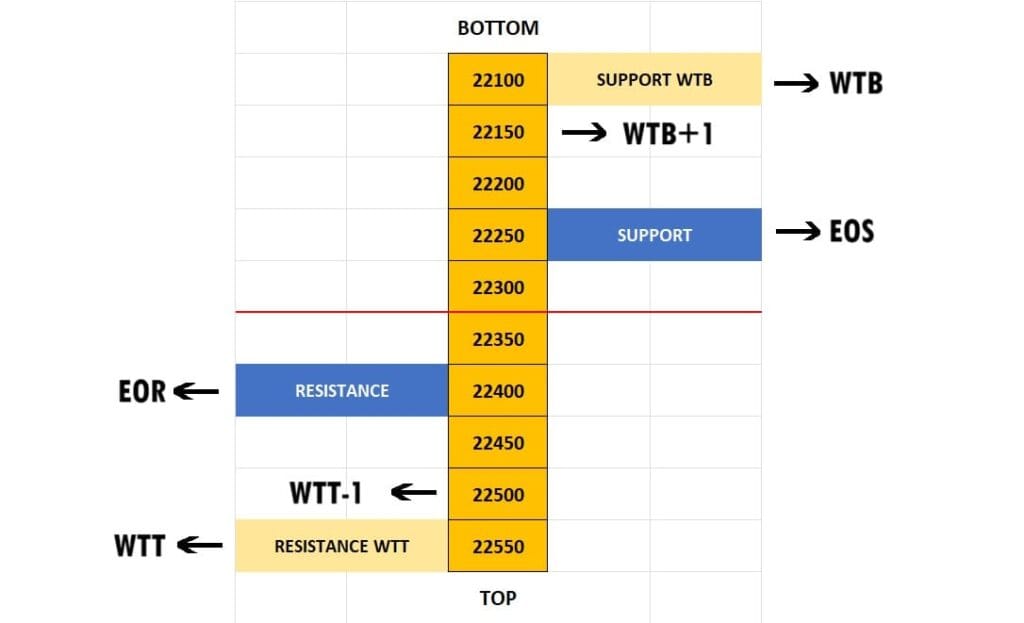
In the above image, Resistance is WTT and Support is WTB. As we have already learned, +1 means one strike price above the WTT/WTB, i.e., towards the top of the option chain. When we refer to -1, it means we are talking about smaller strike prices, i.e., towards the bottom of the option chain. -1 means one strike price below the WTT/WTB.
Chart of Accuracy 1.0
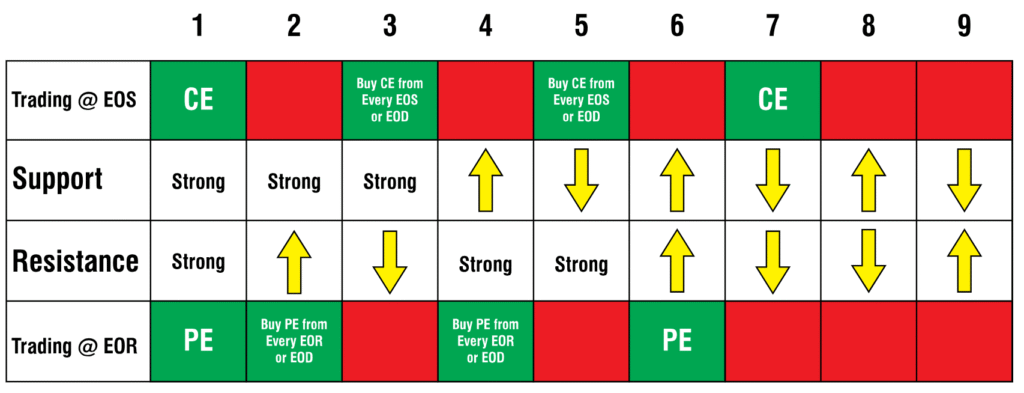
Dr. Vinay Prakash Tiwari, the Founder & CEO of Investing Daddy, who also invented the LTP Calculator, has given the Theory of the Chart of Accuracy 1.0. This chart includes nine theories or nine scenarios around which the entire Indian market revolves. Trading with the Chart of Accuracy has always been profitable for traders.
In the above image of Chart of Accuracy 1.0, You can see the Trading at EOS and also the green and red color boxes in that row. Green color allows you to trade at EOS while red color indicates not to trade at EOS. In the above Chart of Accuracy 1.0, there is also Trading at EOR. Green color allows you to trade at EOR while red color indicates not to trade at EOR. Let’s discuss these nine theories one by one.
Chart of Accuracy 1.1
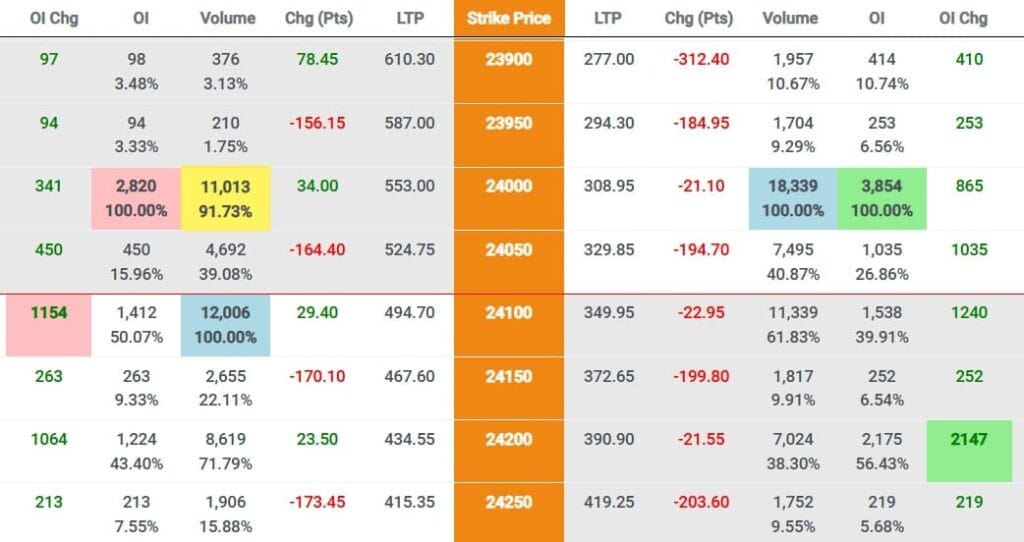
In the Chart of Accuracy, Scenario No. 1 shows that both support and resistance are strong. This is the ideal situation in all nine scenarios of Chart of Accuracy 1.0. Let’s understand: When such a scenario occurs in the market, what would be the top and bottom of the market?
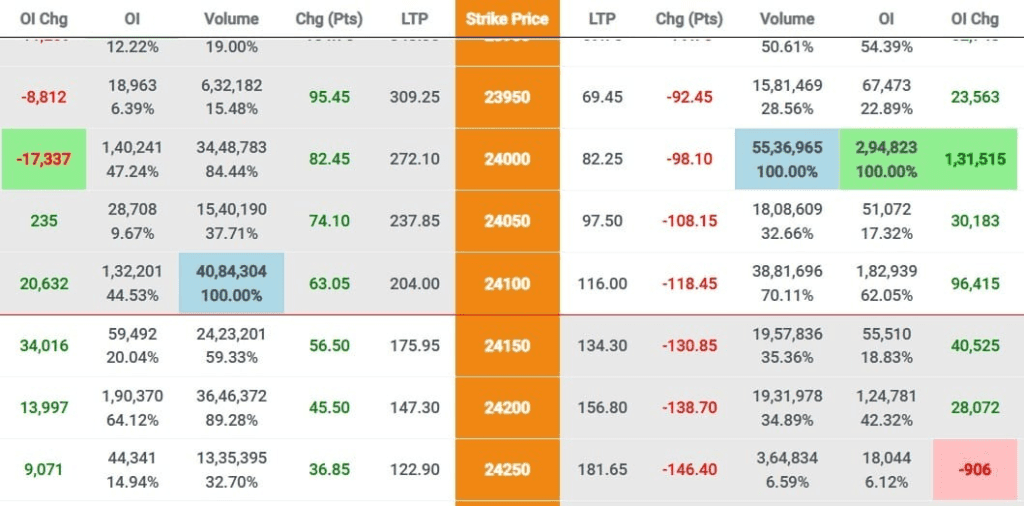
In the above example, you can see that resistance is at 24,100 and support is at 24,000, and both are strong. In such cases, we can expect reversals from both sides— Extension of Support (EOS) and Extension of Resistance (EOR). To get the EOS, we need to click on the volume of support (in this case, support is at 24,000). To get the EOR, we need to click on the volume of resistance (in this case, resistance is at 24,100).
As we already know, at the extension of support, we should buy call options, buy futures, and sell put options. At the extension of resistance, we should sell call options, sell futures, and buy put options.
Please Note: First hit to any level, whether it is an extension or a diversion, is generally safe. As the number of hits increases, the risk also increases. What is the risk here? The risk involves the breakout or breakdown of the support or resistance, at which we are trading. If support or resistance breaks, the market will reverse from the next strike price diversion. In this case, if support breaks, 23,950 is the next strike price; if resistance breaks, 24,150 will be the next strike price.
Conclusion: Bottom is EOS and Top is EOR
Chart of Accuracy 1.2
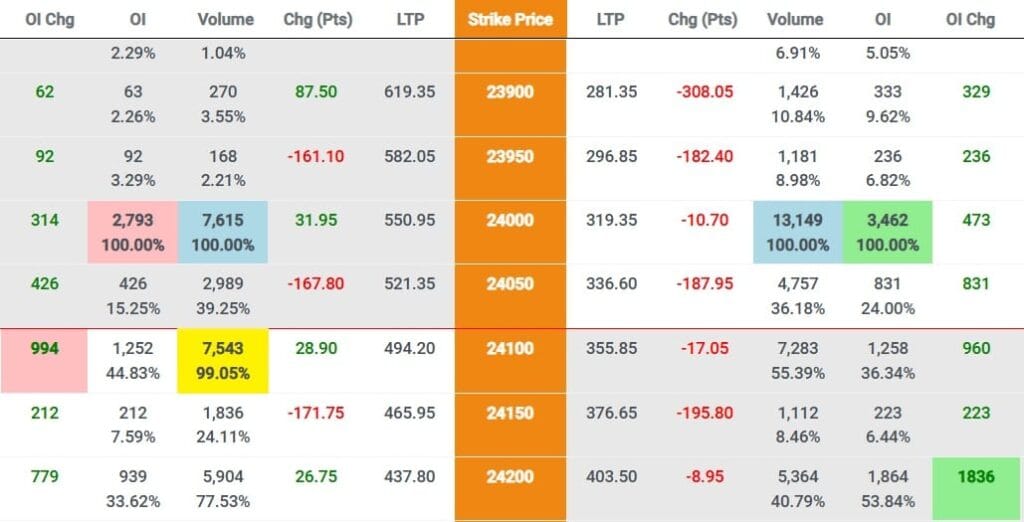
In the Chart of Accuracy, in Scenario No. 2, you can see that support is strong, but resistance is WTB, indicating pressure on support (i.e., bearish pressure). This scenario leads to a bearish market because support will break down, and the market generally reverses from one diversion next to support.
In the above example, you can see that resistance is at 24,100 and support is at 24,000. However, in this case, resistance is weak towards bottom (WTB) at 24,000, which creates bearish pressure on support. Due to this bearish pressure, support will break down, and the market will reverse from one next diversion to support, i.e., from the diversion at 23,950. To get the diversion of 23,950, you need to click on the volume of 23,950 strike price.
Conclusion: Top is EOR and Bottom is EOS-1
Chart of Accuracy 1.3
In the Chart of Accuracy, in Scenario No. 3, you can see that support is strong, but resistance is WTT, indicating bullish pressure. This scenario leads to a bullish market because resistance will breakout, and the market generally reverses from one diversion prior to the strike price at which resistance is WTT.
In the above example, you can see that resistance is at 24,000 and support is at 24,000. However, in this case, resistance is weak towards top (WTT) at 24,100. Due to this WTT in resistance, Resistance will breakout, and the market will reverse from the one diversion prior to the strike price at which resistance is WTT, i.e., from the diversion at 24,050. To get the diversion of 24,050, you need to click on the volume of 24,050 strike price.
Conclusion: Top is WTT-1 and Bottom is EOS
Chart of Accuracy 1.4
In the Chart of Accuracy, in Scenario No. 4, you can see that support is WTB and resistance is strong. This scenario leads to a bearish market because support will breakout, and the market generally reverses from one diversion prior to the strike price at which support is WTB.
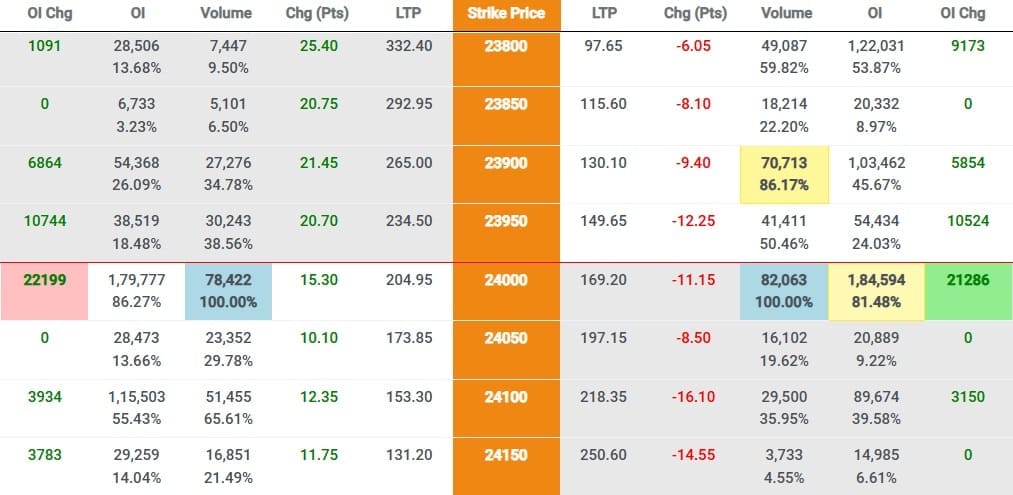
In the above example, you can see that resistance is at 24,000 and support is at 24,000. However, in this case, support is weak towards top (WTB) at 23,900. Due to this WTB in support, support will breakdown, and the market will reverse from the one diversion prior to the strike price at which support is WTB, i.e., from the diversion at 23,950. To get the diversion of 23,950, you need to click on the volume of 23,950 strike price.
Conclusion: Top is EOR and Bottom is WTB+1
Chart of Accuracy 1.5
In the Chart of Accuracy, in Scenario No. 5, you can see that support is WTT, but resistance is strong, indicating pressure on resistance (i.e., bullish pressure). This scenario leads to a bullish market because resistance will break-out, and the market generally reverses from one diversion next to resistance.
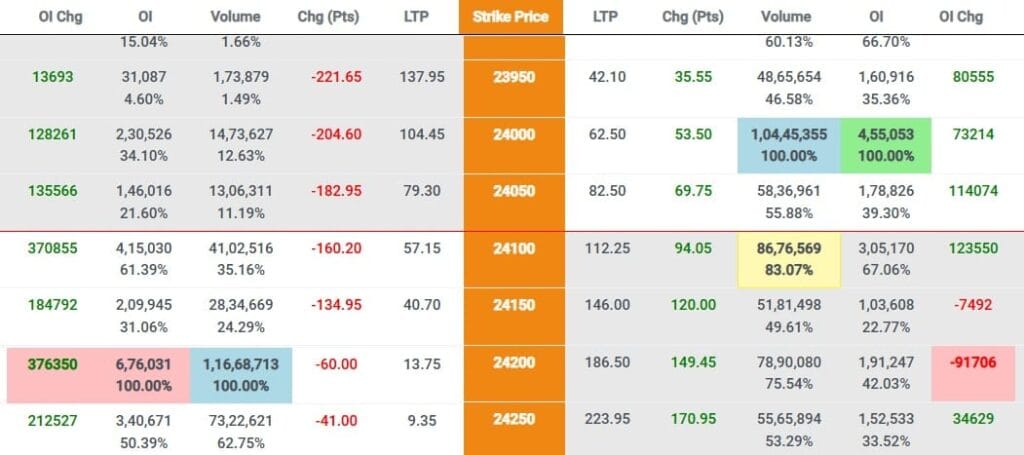
In the above example, you can see that resistance is at 24,200 and support is at 24,000. However, in this case, support is weak towards top (WTT) at 24,100, which creates bullish pressure on Resistance. Due to this bullish pressure, resistance will break-out, and the market will reverse from the next diversion to resistance, i.e., from the diversion of 24,250. To get the diversion of 24,250, you need to click on the volume of 24,250 strike price.
Conclusion: Top is EOR+1 and Bottom is EOS
Chart of Accuracy 1.6
In the Chart of Accuracy, in Scenario No. 6, you can see that both support and resistance is WTB, indicating bearish pressure on both sides. Whenever there is double bearish pressure, it is called a Blood Bath (i.e., Highly Bearish). In such cases, there is no bottom in the market, so never take any bullish trades in such situations.
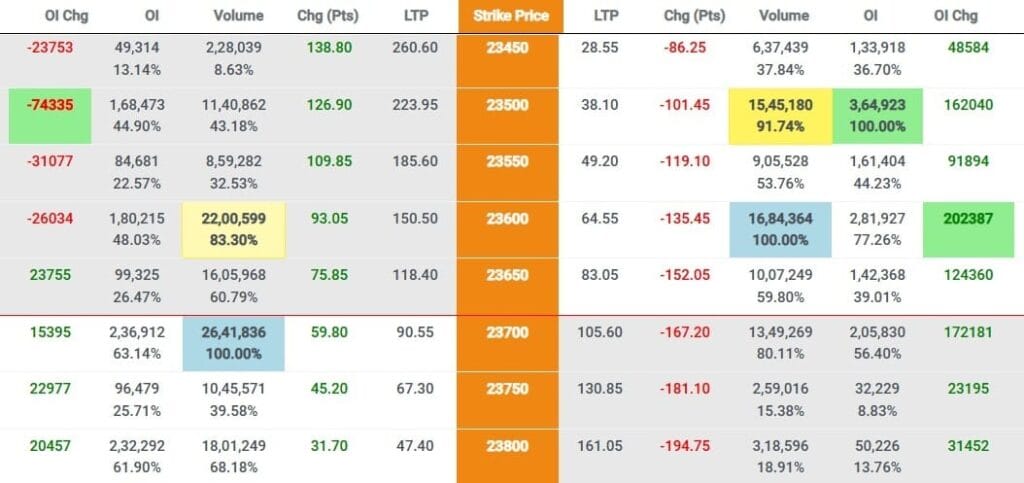
In the above example, you can see that resistance is at 23,700 and support is at 23,600. However, in this case, support is weak towards the bottom (WTB) at 23,500, and resistance is also weak towards the bottom at 23,600 (WTB). There is double bearish pressure, which is called a Blood Bath. Due to this, there are no bullish trades in the market.
Conclusion: Top is EOR and Bottom is N/A
Chart of Accuracy 1.7
In the Chart of Accuracy, in Scenario No. 7, you can see that both support and resistance is WTT, indicating bullish pressure on both sides. Whenever there is double bullish pressure, it is called Bull Run (i.e., Highly Bullish). In such cases, there is no top in the market, so never take any bearish trades in such situations.
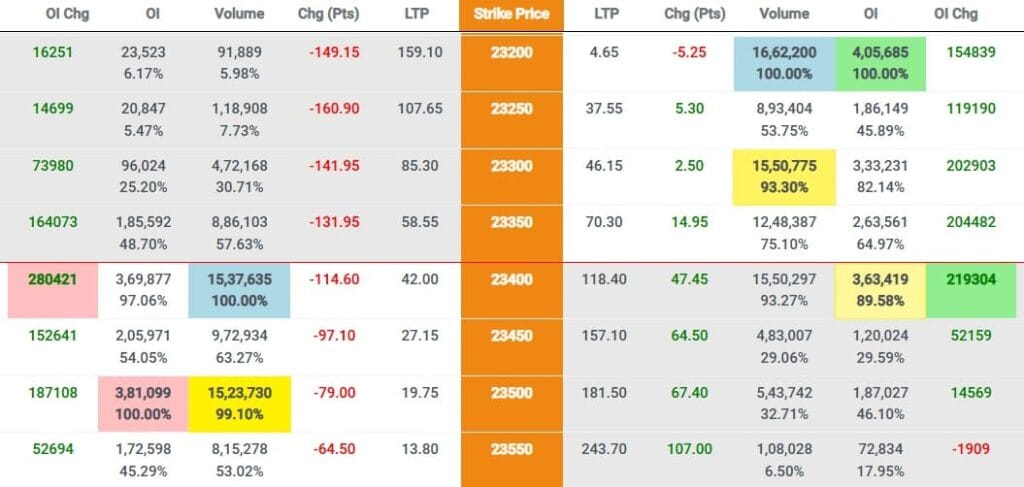
In the above example, you can see that resistance is at 23,400 and support is at 23,200. However, in this case, support is Weak towards Top (WTT) at 23,400, and resistance is also WTT at 23500. There is double bullish pressure, which is called a Bull Run. Due to this, there are no bearish trades in the market.
Conclusion: Bottom is EOS and Top is N/A
Chart of Accuracy 1.8
In the Chart of Accuracy, in Scenario No. 8, you can see that support is WTB and resistance is WTT. This type of situation is not tradable.
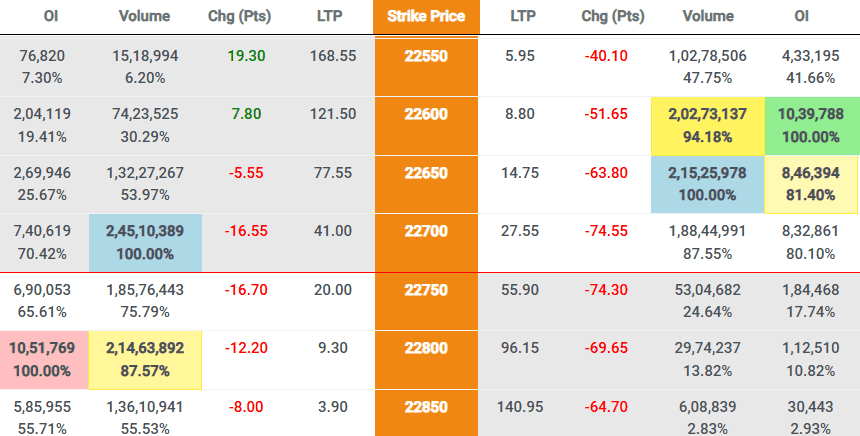
In the above example, you can see that the support is at 22,650 and it is WTB at 22,600. The resistance is at 22,700 and it is WTT at 22,800. In such cases, when both support and resistance are not strong, we should avoid trading. In Detailed Chart of Accuarcy 1.0 we will learn how to trade in such conditions.
Conclusion: Wait until either the support or resistance becomes strong
Chart of Accuracy 1.9
In the Chart of Accuracy, in Scenario No. 9, you can see that support is WTT and resistance is WTB. This type of situation is not tradable.
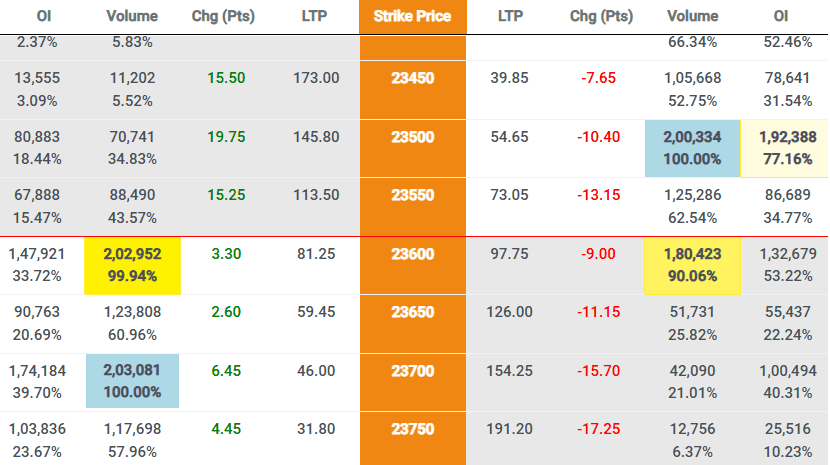
In the above example, you can see that the support is at 23,500 and it is WTT at 23,600. The resistance is at 23,700 and it is WTB at 23,600. In such cases, when both support and resistance are not strong, we should avoid trading. In Detailed Chart of Accuarcy 1.0 we will learn how to trade in such conditions.
Conclusion: Wait until either the support or resistance becomes strong.
Conclusion
In this chapter of the LTP Calculator free course, we learned about the theory of the Chart of Accuracy 1.0. This theory has nine combinations of support and resistance conditions, and these nine combinations form nine scenarios around which the entire Indian market revolves. My motive with this chapter was to teach you how to identify the top and bottom of the market under different support and resistance conditions.
So, keep learning the stock market with LTP Calculator, and believe me, one day you’ll also say, It’s a Baccho ka Khel.