
CHART OF ACCURACY 2.0

In the previous chapters, we learned about support, resistance, and the chart of accuracy 1.0 along with its nine scenarios. In this chapter, we will learn the theory of the chart of accuracy 2.0, which is entirely based on open interest. Let us start learning.
Lesson Highlights
Open Interest Graph
As we have already learned about open interest in previous chapters, so, we can easily understand the chart of accuracy 2.0. The Chart of Accuracy 2.0 is entirely based on open interest or OI Change. In the image below, we have explained how to open the OI graph on the LTP Calculator. You can open the OI graph by clicking on the OI change value on either side of any strike price. The graph will display the open interest change of both call side and put side, from 9:15 AM to the current market time.
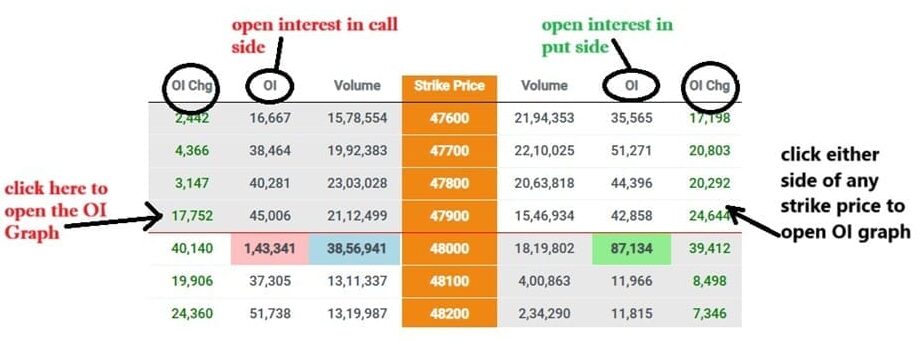
The OI graph helps you compare the open interest of call side and put side, providing a clear picture of the market. In the above image, we can see an imaginary line between 48000 and 47900. Let’s assume the market is trading at 47920, making 47900 the ATM strike price. We should then open the OI graph for 47900 by clicking on the OI change column on either side of the strike price. A new page will open, as shown in the image below.
on AI LTP Calculator, you just need to check the reversal prices to find the ATM strike price. The strike price with reversal values visible in both side – call and put, is generally the ATM strike price.
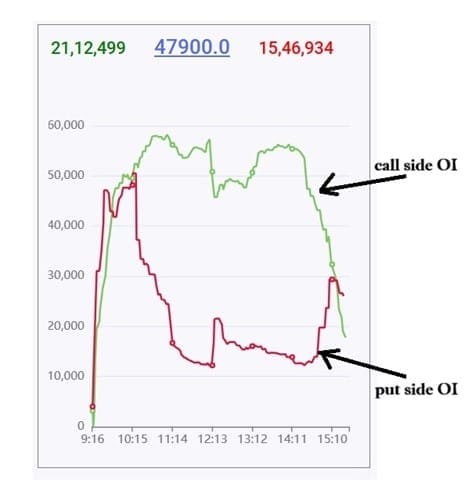
In this image, there is a green line indicating the open interest of the call side at different time stamps. While the red line in the image is indicating the open interest on the put side at different time stamps.
Nine Scenarios of Open Interest
Call side open interest and put side open interest both try to stop the market. Call side open interest prevents the market from moving upward, while put side open interest prevents the market from moving downward. Simply put, we can understand that call side open interest acts as resistance and put side open interest acts as support.
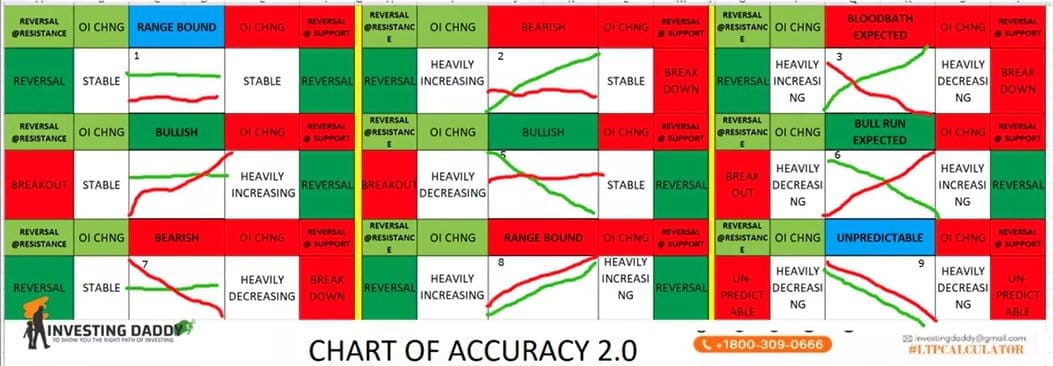
The open interest of call options and put options can be in three conditions: stable, decreasing, and increasing. This means that the three conditions of call side open interest and the three conditions of put side open interest together makes the nine combinations of call and put open interest and these nine combinations together make the chart of accuracy 2.0.
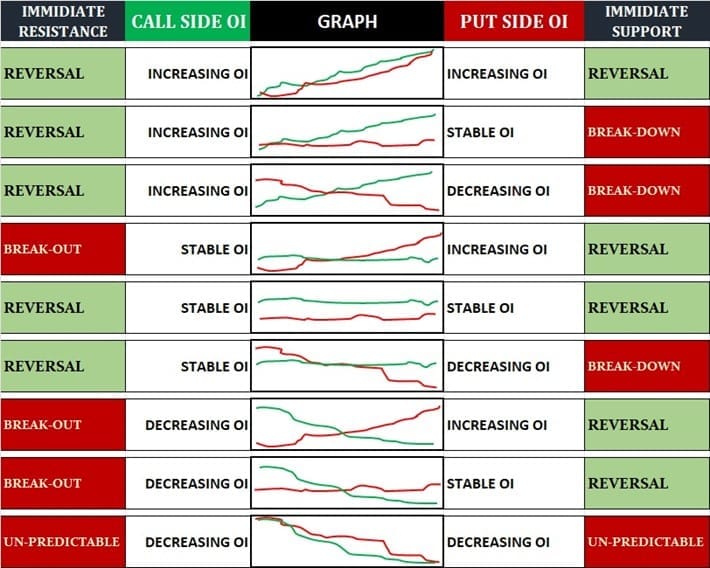
Call side Open Interest is increasing and Put side Open Interest is also increasing: In this scenario, we can expect the market to reverse from both sides — immediate support and immediate resistance i.e. consolidated at that strike price range.
Call side Open Interest is increasing and Put side Open Interest is stable: If the call side Open Interest is rising while the put side remains stable, the market is likely to reverse from immediate resistance, but immediate support may break down.
Call side Open Interest is increasing and Put side Open Interest is decreasing: When call side Open Interest is on the rise and put side Open Interest is falling, expect the market to reverse from immediate resistance, but immediate support will break down.
Call side Open Interest is stable and Put side Open Interest is increasing: With stable call side Open Interest and increasing put side Open Interest, the market will probably reverse from immediate support, but immediate resistance could break out.
Call side Open Interest is stable and Put side Open Interest is also stable: If both sides are stable, the market will likely reverse from both immediate support and immediate resistance i.e. consolidated at that strike price range.
Call side Open Interest is stable and Put side Open Interest is decreasing: In this case, the market will reverse from immediate resistance, but immediate support may break down.
Call side Open Interest is decreasing and Put side Open Interest is increasing: With a decrease in call side Open Interest and an increase in put side Open Interest, the market is expected to reverse from immediate support, while immediate resistance may break out.
Call side Open Interest is decreasing and Put side Open Interest is stable: If the call side Open Interest is falling and the put side remains stable, the market will reverse from immediate support, but immediate resistance will break out.
Call side Open Interest is decreasing and Put side Open Interest is also decreasing: In this case, the market becomes unpredictable. Both sides weakening creates uncertainty, and you may notice this happening regularly after 2:30 PM. This is why we generally avoid trading after 2:30 PM using the LTP Calculator, as the market becomes more volatile and difficult to predict.
Chart of Accuracy 2.0
The theory of chart of accuracy 2.0 is most unique theory of open interest and this has been given by our mentor Dr. Vinay Prakash Tiwari. Above mentioned nine combinations are the nine scenarios of chart of accuracy 2.0. Let’s understand the methods of using chart of accuracy 2.0 –
- Always try to use chart of accuracy 2.0 between 9:45 AM to 2:30 PM. Reason behind this is that, before 9:45 new positions are being created by writers. And after 2:30 writers are squaring off their positions. And in both the scenarios, if we check chart of accuracy 2.0, it can misguide us.
- Never check chart of accuracy 2.0 at extensions, specially when it is the first hit to extension. when market again comes at extension for second hit, you can check for chart of accuracy 2.0.
- You can use chart of accuracy 2.0 when market is consolidated (range bound) and also when market is trading at diversions and end of diversions.
Conclusion
In this chapter of LTP Calculator free course, we understood the nine combinations of open interest and these nine combinations makes the nine scenarios of chart of accuracy 2.0. My motive with this chapter was to teach you the role of open interest in our day to day trading and also how we should use chart of accuracy 2.0
So, keep learning the stock market with LTP Calculator, and believe me, one day you’ll also say, It’s a Baccho ka Khel.