
WTT AND WTB ON LTP CALCULATOR

In the previous chapter, we learned the theory of support and resistance using the LTP Calculator option chain. In this chapter, we will understand the concept of weak towards top (WTT) and weak towards bottom (WTB) in support and resistance on AI LTP Calculator. Let’s start learning.
Lesson Highlights
Types of Support and Resistance
In the previous lesson, we learned the definition of Support and Resistance.
Definition of Support and Resistance: Starting from the pair of imaginary line strike prices and moving towards the OTM strike prices, highest volume or highest open interest, whichever is closest to the imaginary line, is called as resistance on the call side and support on the put side.
Support and Resistance can be either strong or weak. When Support and Resistance are weak, they can be weak either towards the top or towards the bottom. Therefore, we can conclude that there are three possible conditions for Support and Resistance:
- Strong refers to those support and Resistance which is stable and is not trying to shift anywhere. This means that, on the option chain you will not see any yellow box in the volume or open interest (OI) column.
- Weak Towards Top (WTT) refer to those support and resistance that are trying to shift towards the top of the option chain—in other words, towards higher strike prices. When Support and Resistance is WTT, then you will see the yellow box in the volume or open interest (OI) column.
- Weak Towards Bottom (WTB) refer to those support and resistance that are trying to shift towards the bottom of the option chain—in other words, towards lower strike prices. When Support and Resistance is WTB, then you will see the yellow box in the volume or open interest (OI) column.
Top and Bottom on Option Chain
Before moving ahead, first look at the below image of LTP Calculator option chain. What do you think, i made a mistake in writing Top and Bottom of the option chain. But in fact, it is not the mistake, it is correct. Because the option chain which is displayed to you anywhere, is always inverted meaning the top of the option chain is at the bottom and the bottom of the option chain is at the top.
Still confused? Now, look at the strike prices. You can see that the smaller strike prices are at top (bottom of the option chain) and larger strike prices are at the bottom (top of the option chain).
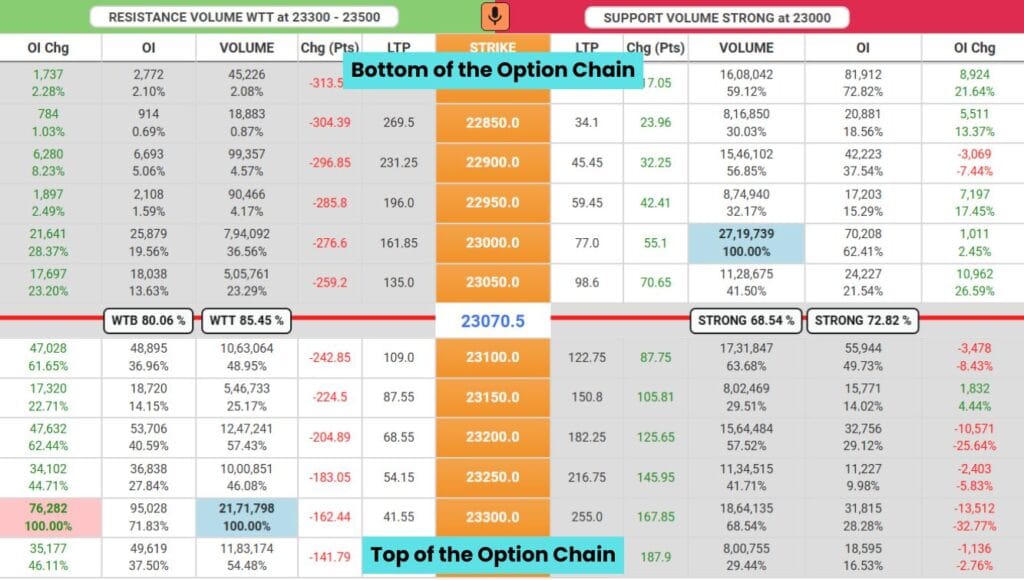
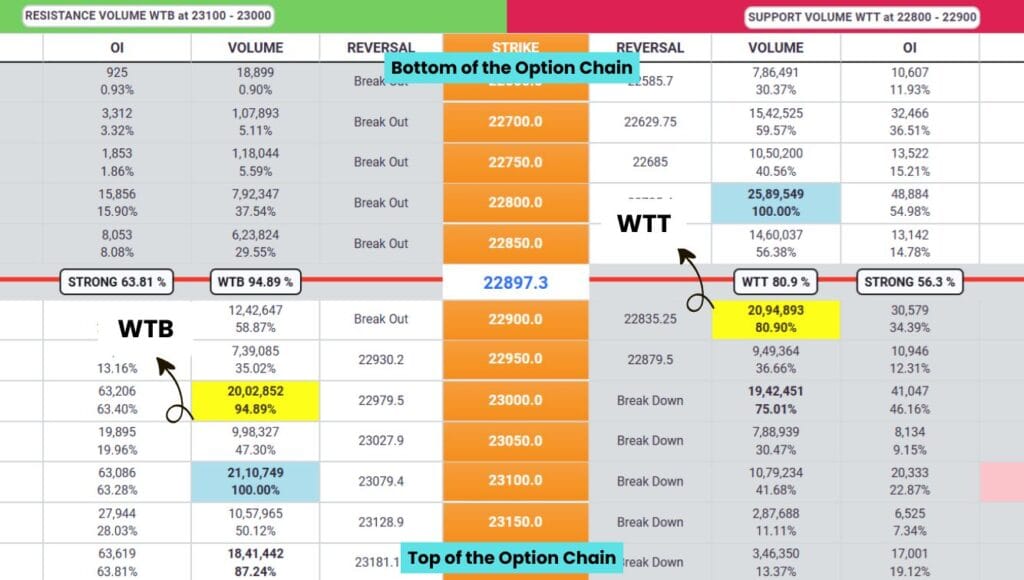
WTB: In the above image, support is currently at 23000. Suppose this support is trying to shift to 22,900, meaning there is a yellow box at the 22900 strike price. Then, that support will be called Weak towards Bottom because support is trying to shift towards the bottom of the option chain (towards the lower strike prices).
WTT: In the above image, support is currently at 23000. Suppose this support is trying to shift to 23,100, meaning there is a yellow box at the 23100 strike price. Then, that support will be called Weak towards Top because support is trying to shift towards the top of the option chain (towards the higher strike prices).
WTT and WTB on LTP Calculator
From the above discussion, we understood that the support and resistance can be in three conditions – Strong, Weak towards Top and Weak towards Bottom. Support and Resistance can based solely on volume or open interest, or on both. In both scenarios, the conditions for Weak Towards Top and Weak Towards Bottom are different. Let’s understand WTT and WTB on LTP Calculator in both scenarios –
If Support and Resistance is based solely on Volume or Open interest
CONDITION 01: Check which is closer to the imaginary line – volume or open interest. Whichever is closer, if it is strong, then support or resistance is also called strong. If it is weak towards the top, then support or resistance is also called weak towards top (WTT). If it is weak towards the bottom, then support or resistance will also be called weak towards bottom (WTB).
CONDITION 02: Moving forward the above condition, If support and resistance are based solely on Volume or Open Interest, it means that the other factor (Volume or OI) is far from the imaginary line. If that factor becomes weak and tries to shift closer to the imaginary line, a yellow box will appear in the other factor’s column. In call side, this yellow box will be called WTB and in put side, this yellow box will be called WTT. If this yellow box does not cross or bypass the existing support or resistance, it will not show any effect. Support and Resistance will be strong as it was earlier.
CONDITION 03: Moving forward the above condition, if this yellow box crosses or bypasses the existing support or resistance, it will affect the support and resistance. In this case, resistance will be called as Weak towards Bottom (WTB), and support will be called as Weak towards Top (WTT). But remember, Support and Resistance will be same, as it was earlier. Only the status of Support and Resistance has been changed from Strong to WTB/WTT. This will change the COA, which we will learn later.
If Support and Resistance is of both Volume and Open Interest
CONDITION 01: If both Volume and Open Interest are strong, then the Support or Resistance will also be considered strong. However, if either Volume or Open Interest becomes weak and is trying to move away from the imaginary line, then both must move away from the imaginary line for the Support or Resistance to be considered weak. If only one is moving away, the Support or Resistance cannot be considered weak.
CONDITION 02: Moving forward the above condition, If either Open Interest or Volume tries to move closer to the imaginary line, then in such cases, the Support and Resistance will be considered weak. In this case, resistance will be called as Weak towards Bottom (WTB), and support will be called as Weak towards Top (WTT). But remember, Support and Resistance will be same, as it was earlier. Only the status of Support and Resistance has been changed from Strong to WTB/WTT.
CONDITION 03: If both Volume and Open Interest both are weak, in which one factor is WTT (Weak towards Top) and the other factor is WTB (Weak towards Bottom), then we will give priority to the factor that is moving closer to the imaginary line. In this case, resistance will be called as Weak towards Bottom (WTB), and support will be called as Weak towards Top (WTT).
Conclusion
In this chapter of the LTP Calculator free course, we learned the concept of WTT and WTB on the LTP Calculator option chain. My motive with this chapter was to teach you how to identify the status of support and resistance, whether it is strong or weak. If it is weak, then identify whether it is weak toward the top or the bottom. This learning will help you find the scenario of Chart of Accuracy 1.0, which we will learn in upcoming chapters.
So, keep learning the stock market with LTP Calculator, and believe me, one day you’ll also say, It’s a Baccho ka Khel.