
MARKET MOOD INDEX
In the previous lesson, we learned the concepts of Futures and Options in Indian Stock Market. Now, in this lesson, we are going to understand the stock market fundamental analysis tool: Market Mood Index. This Fundamental analysis tool Market mood Index (MMI) has been developed by the tickertape. You can use this by visiting the official website of tickertape.
Lesson Highlights
What is Market Mood Index?
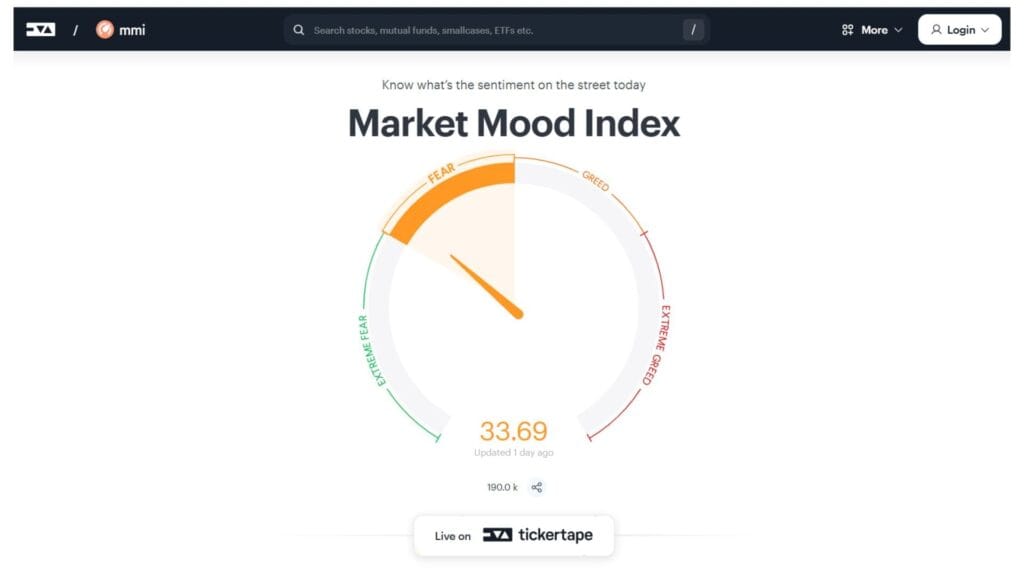
The Market Mood Index or Fear & Greed Index is a fundamental analysis tool for the Indian Stock Market. It is a sentiment indicator that reflects the general feeling or mood of market participants. It combines different metrics and indicators to reflect the market sentiment.
The MMI takes six important factors into account to provide a complete picture of the emotions driving the market:
- FII Activity
- Volatility and Skew
- Momentum
- Market Breadth
- Price Strength
- Demand for Gold
How does the Market Mood Index work?
The MMI reflects market sentiment in the form of a numerical value. This value can be represented on a scale ranging from 0 to 100, with:
- 0 to 30: Extreme Fear Zone
- 31 to 50: Fear Zone
- 50 to 70: Greed Zone
- 70 to 100: Extreme Greed Zone
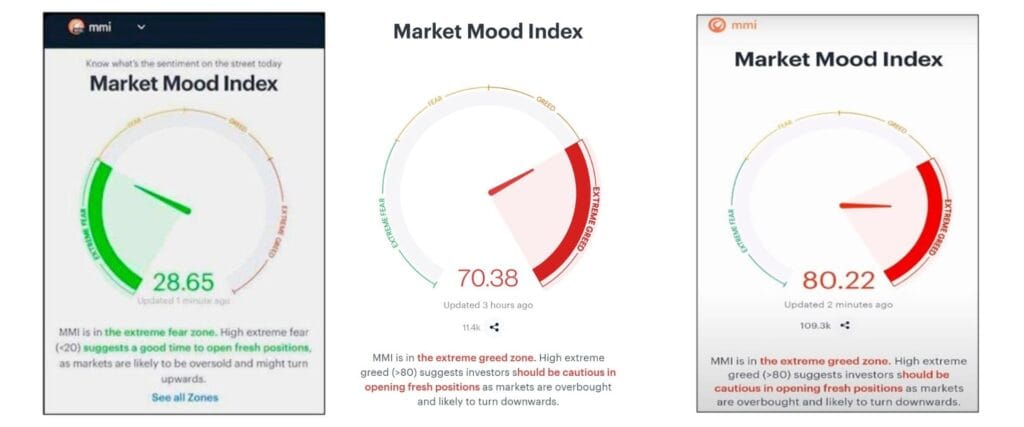
When the MMI is in the Extreme Fear zone, it means that the market is trading nearby its lowest point (bottom). Many traders, scared of losing more money, sell their stocks, thinking the market will keep falling. But for smart traders, this is the perfect time to buy & make fresh positions because the market is likely to rise again.
When the MMI is in the Fear zone or Greed zone, the market is in the middle ground. It can either go up from here or move down again. Therefore, during this phase, traders should avoid making new positions based on the belief that the market will continue to the Extreme Greed zone. The market can easily fall back to the Extreme Fear zone, which could result in losses for your trades or positions.
When the MMI is in the Extreme Greed zone, it means that the market is nearby its highest point (top). Most traders get excited and buy stocks, thinking prices will keep going up. But this is often the time when the market is about to fall, and these traders can get trapped. For smart traders, this is the right time to sell or even bet on prices going down because the market is ready to go down.
Market Mood Index with LTP Calculator
As we already understood, when the market is in the Extreme Fear Zone, we should look for buying opportunities rather than selling our existing positions. Similarly, when the market is in the Extreme Greed Zone, we should look for selling opportunities instead of buying new positions. With the Market Mood Index (MMI), we can also trade Nifty Futures. When the MMI is in the Extreme Greed Zone, you can buy Nifty Futures, and when the MMI is in the Extreme Fear Zone, you can sell Nifty Futures.
From What levels we should Buy or Sell?
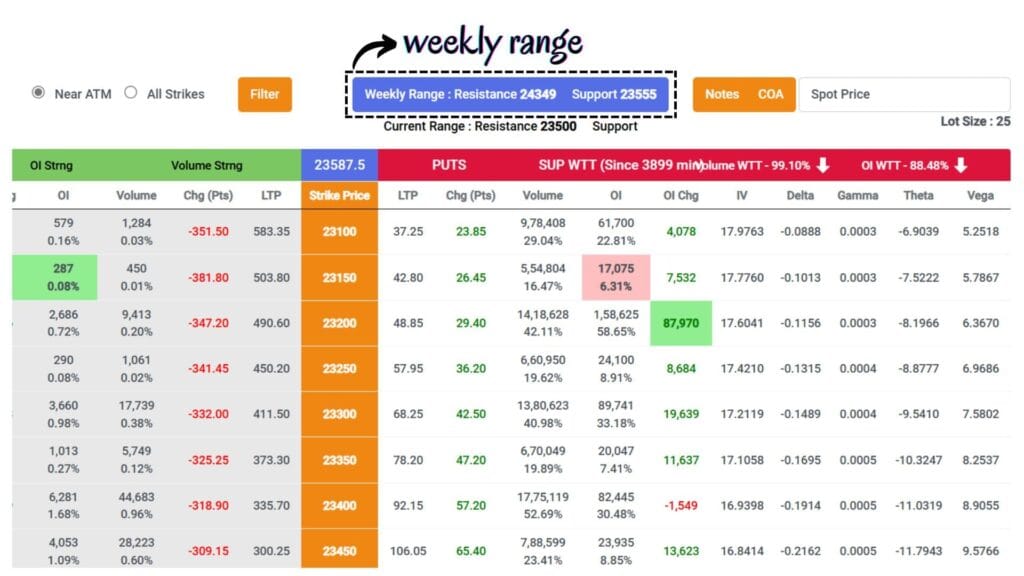
On the LTP Calculator, we will have the Weekly Range, which consists of two levels: Top and Bottom. The Top level (Resistance) indicates that the particular index is expected to close below this level by the weekly expiry. The Bottom level (Support) indicates that the index is expected to close above this level by the weekly expiry. This Weekly Range gets updated every week. We will discuss this in detail in the upcoming lesson.
When the market is in the Extreme Fear Zone, we should look for the support levels in the weekly range. The market may reverse from the support of the current weekly range. If the current weekly range support fails to reverse the market, it is more likely to reverse from the support of the next weekly range. Always remember, this type of trade is highly risky. Target for this trade will be the Extreme Greed Zone. When MMI reaches the Extreme Greed Zone, we will exit from the trade.
When the market is in the Extreme Greed Zone, we should look for the resistance levels in the weekly range. The market may reverse from the resistance of the current weekly range. If the current weekly range resistance fails to reverse the market, it is more likely to reverse from the resistance of the next weekly range. Always remember, this type of trade is highly risky. Target for this trade will be the Extreme Fear Zone. When MMI reaches the Extreme Fear Zone, we will exit from the trade.
Conclusion
In this lesson, we explored the Market Mood Index and also learned how to get benefit from this fundamental analysis tool. The combination of the LTP Calculator and the Market Mood Index is an extremely powerful tool for Nifty Futures trading. Always keep in mind that these types of trades are highly risky, and you must trade within your risk capacity.