
OPEN INTEREST ON AI LTP CALCULATOR

For a long time, Open Interest was the first love of option traders on the option chain. Everyone who claimed to be an expert in option chain data analysis relied mostly on Open Interest. On the AI LTP Calculator, when the market is consolidated, Open Interest shows us the market’s upcoming movements with the chart of accuracy 2.0. Let’s understand what open interest is.
Lesson Highlights
What is Open Interest ?
Open Interest refers to the total number of outstanding contracts (either long or short) that have not been closed or settled. It increases when new contracts are created and decreases when positions are closed by the writers. In simple terms, the open positions of writers are referred to as Open Interest.
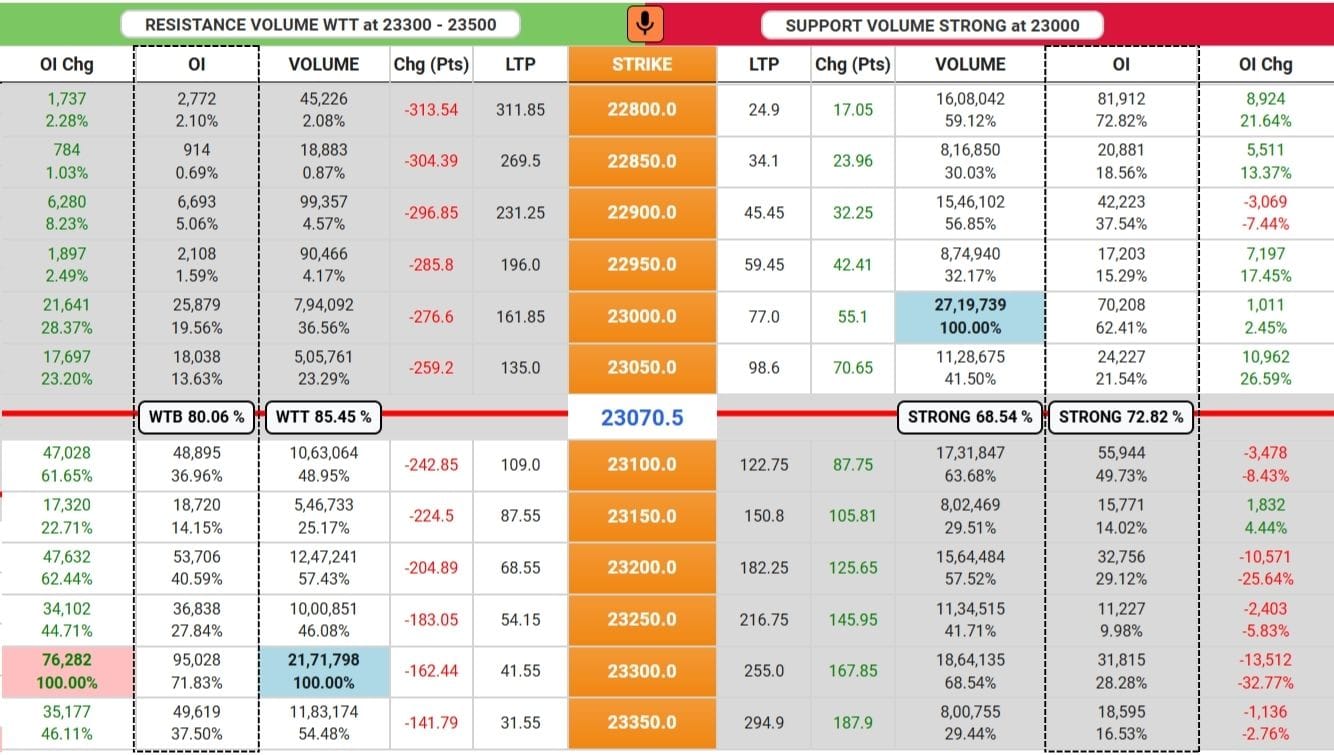
In the above image of the LTP Calculator, you can see the open interest on both sides – call side and put side. Call side open interest is the open positions of call writers, and they are in a bearish position. Put side open interest is the open positions of put writers, and they are in a bullish position.
Let’s think more: if you are buying a call option, what will be your motive and how will you get profit? Yes, your thinking is that the market will go up and only then you will be in profit. But think again: if you have bought a call option, then someone has also sold that option to you. What was his motive and how will he get profit? Yes, his thinking is that the market will go down and only then he will be in profit. If you have bought a call option then you are bullish, and when writers sell their call options they are bearish. It means that the call-side open interest represents bears.
Let’s think more: if you are buying a put option, what will be your motive and how will you get profit? Yes, your thinking is that the market will go down and only then you will be in profit. But think again: if you have bought a put option, then someone has also sold that option to you. What was his motive and how will he get profit? Yes, his thinking is that the market will go up and only then he will be in profit. If you have bought a put option then you are bearish, and when writers sell their put options they are bullish. It means that the put-side open interest represents bulls.
- Writers are those who sell their positions before buying them and that selling positions by writers creates open interest. That’s why, when writer square off their position, open interest decreases.
- On the option chain, Open Interest creates volume.
- Open Interest can Increase and also can decrease. This feature makes it untrustworthy. It can be minimum zero but never can be negative.
- Open Interest does not start from zero every day like volume does; it starts from where it was closed in the last trading session. Open Interest is positional data.
What is Open Interest Change ?
Before moving ahead, keep it in your mind: anywhere in the stock market, when you see the word change, it means the current data is being compared with the previous trading session’s closing data.
Open Interest change refers to the difference between the last trading day closing open interest and today’s current open interest. On the option chain, open interest change is more helpful than open interest when predicting the direction of the market. Theory of chart of accuracy 2.0 is totally based on the open interest change.
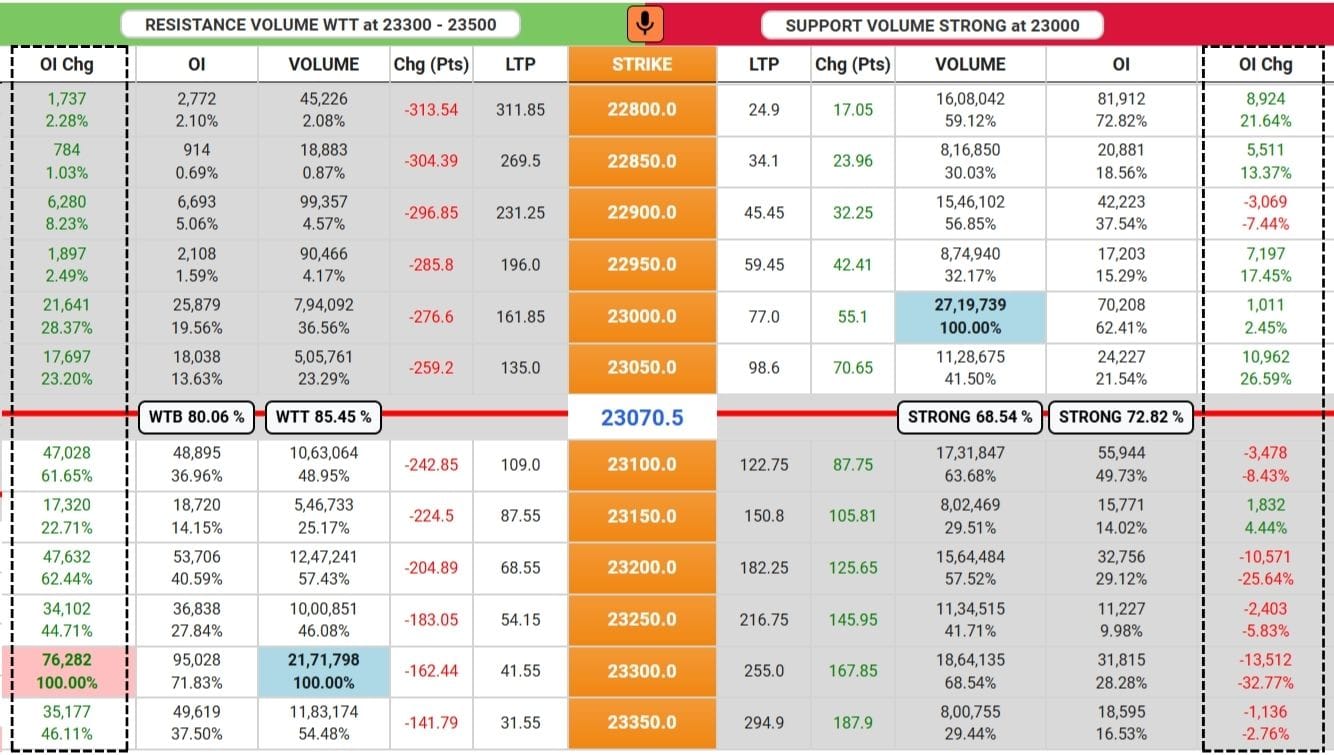
In the above image of the LTP Calculator, you can see the OI change on both sides — call side and put side. There is green and red text. Green means the current OI is greater than the last trading session’s closing OI, which represents that new positions are being created there. Red means the current OI is lower than the last trading session’s closing OI, which represents that writers have booked (closed) their positions.
- OI change is the intraday data. It daily starts from zero.
- OI Change can increase and decrease as well and also can be negative.
How data forms on option chain ?
Learning how data forms on option chain, will clear your all doubts regarding Volume, Open Interest and Open Interest change. To understand the data formation on option chain, we need to create a table and suppose the following data is forming at a particular strike price
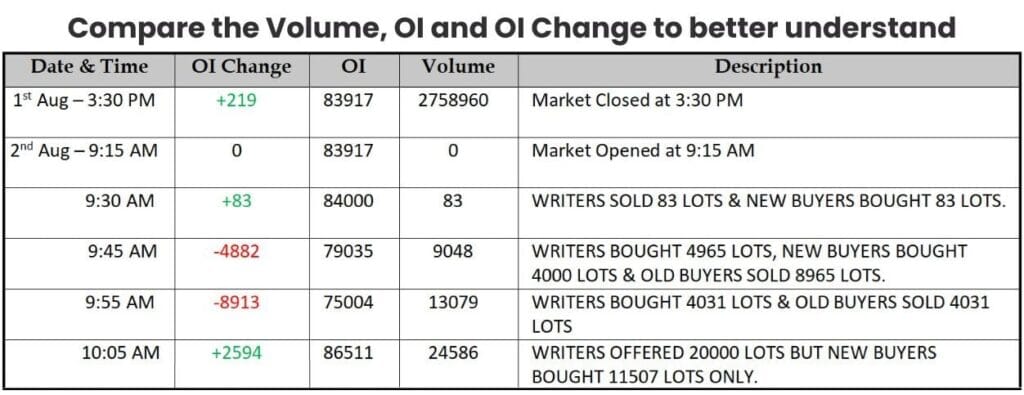
Row 01: You can see that on 1st August at 3:30 PM, the market closed with the given data.
Row 02: On the next trading day, 2nd August, market opened at 9:15 AM. Here, you can observe that Volume and OI change, which are intraday data, are both 0. This is because the market has just opened, and no trades have been executed yet. However, the open interest is 83,917, which is the same as it was at the close of the previous trading day. This is because open interest starts from where it was at the close of the last trading day.
Row 03: At 9:30, the OI change is positive by 83, and the Volume is also 83. This indicates that the writers offered 83 lots and buyers bought 83 lots. That is why open interest also increased by 83 (OI changed from 83,917 to 84,000). Volume created here is 83.
Row 04: At 9:45, OI change is negative by 4,882, which indicates that writers squared off their positions. Earlier, it was +83, and now it is -4,882. Total lots squared off by writers (83 + 4,882) is 4,965. But the Volume here is 9,048; earlier it was 83. Total new volume generated (9,048 – 83) is 8,965. This indicates that buyers also traded among themselves. Total volume generated by buyer-to-buyer trades (8,965 – 4,965) is 4,000.
Row 05: At 9:55, OI Change is negative by 8,913, which indicates that writers squared off more positions. Total new lots squared off by writers (8,913 – 4,882) is 4,031. Now, the Volume is 13,079; earlier it was 9,048. Total new volume generated (13,079 – 9,048) is 4,031. Volume is equal to the lots squared off by writers, indicating no buyer-to-buyer trade here.
Row 06: At 10:05, writers offered 20,000 lots to sell, but only 11,507 lots have been traded; the remaining 8,493 lots are still open to be executed. OI change is positive by 2,594, which indicates that writers created new positions. Earlier, it was –8,913, and now it is +2,594. Total new lots created by writers (8,913 + 2,594) is 11,507.
Conclusion
In this chapter of LTP Calculator free course we came to know about the open interest and open interest change and its features on AI LTP Calculator. My motive with this chapter was to teach you the concept of open interest and open interest change and how data forms on option chain from 09:15 onwards. Call writers are bears in market and Put writers are bull in market and in chart of accuracy 2.0 we will learn to predict the market moves with the fight of these bears and bulls.
So, keep learning the stock market with LTP Calculator, and believe me, one day you’ll also say, It’s a Baccho ka Khel.